Poverty Prediction in Bolivia Using Satellite Imagery
This project involves developing a deep learning model to predict poverty levels in Bolivia based on satellite images.
The project uses multiple scripts to train and evaluate the model, including a ResNet-50 architecture for image
classification. You can find the full code here
.
1. Model Training and Architecture
The model is trained on satellite imagery using the ResNet-50 architecture, which has been pre-trained on the ImageNet dataset. Training and validation datasets are processed with data augmentation techniques to improve model robustness.
- Technologies:
- TensorFlow/Keras: Used for building and training the ResNet-50 model.
- Google Colab: Environment for prototyping the model.
- ImageDataGenerator: For data augmentation during training.
            width_shape = 224

            height_shape = 224

            train_datagen = ImageDataGenerator(
            rotation_range=20,

            zoom_range=0.2,

            width_shift_range=0.1,

            height_shift_range=0.1,

            horizontal_flip=True,

            vertical_flip=True,

            preprocessing_function=preprocess_input)
2. Data Augmentation
Data augmentation techniques, such as rotation, zoom, and flipping, are applied to the training and validation datasets to help the model generalize better to unseen images.
            valid_datagen = ImageDataGenerator(
            rotation_range=20,

            zoom_range=0.2,

            width_shift_range=0.1,

            height_shift_range=0.1,

            horizontal_flip=True,

            vertical_flip=True,

            preprocessing_function=preprocess_input)
Both the training and validation datasets are fed into the model using generators, which load batches of images and apply the transformations in real-time.
            train_generator = train_datagen.flow_from_directory(
            train_dir,

            target_size=(width_shape, height_shape),

            batch_size=batch_size,

            class_mode='categorical')


            validation_generator = valid_datagen.flow_from_directory(
            validation_dir,

            target_size=(width_shape, height_shape),

            batch_size=batch_size,

            class_mode='categorical')
3. Model Training
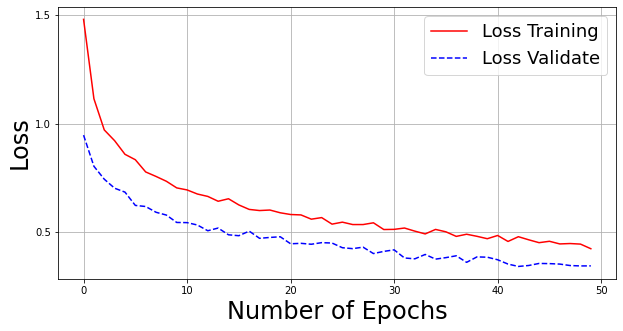
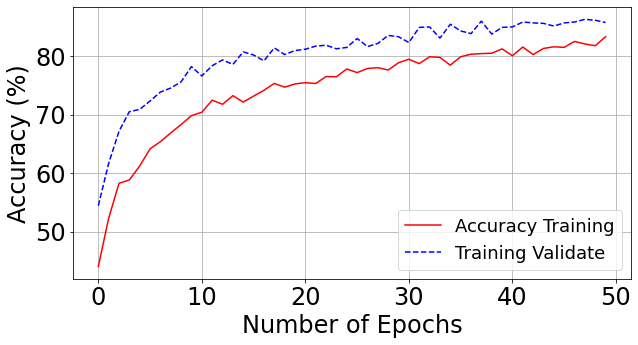
The ResNet-50 model is trained on the augmented dataset for 70 epochs with a batch size of 64. The training process also includes validation at each epoch to monitor the model's performance on unseen data.
The first graph below illustrates the loss during training and validation over the course of 70 epochs. We can observe that the model's training loss (in red) decreases steadily, while the validation loss (in blue) also follows a downward trend, showing that the model is generalizing well.
The second graph shows the accuracy trend during the training process. The red line represents training accuracy, and the blue line shows validation accuracy. Both lines indicate that the model is improving over time, though the validation accuracy fluctuates a little more, suggesting some variance in generalization.
            m_Resnet50 = ResNet50(input_tensor=image_input, include_top=False, weights='imagenet')


            epochs = 70

            model_history = custom_model.fit_generator(
            train_generator,

            epochs=epochs,

            validation_data=validation_generator,

            steps_per_epoch=nb_train_samples//batch_size,

            validation_steps=nb_validation_samples//batch_size)
4. Prediction and Evaluation
Once trained, the model is used to predict the poverty category of the input satellite images. The Predicccion_y_evaluacion script generates predictions and evaluates the model performance using a confusion matrix.
- Technologies:
- Confusion Matrix: For evaluating model accuracy and classification performance.
- Jupyter Notebook: Used for running the prediction script and displaying results.
- tkinter: For displaying the prediction category and whether the image is rural or urban.
5. Visualizing Filters
The Visualize_filters script (currently in progress) loads the trained model and visualizes how the image changes as it passes through the layers of ResNet. This helps in understanding what features the model is learning at different stages.
Technologies Summary
- Languages/Frameworks: Python (TensorFlow/Keras, Tkinter, Jupyter Notebook)
- Deep Learning Model: ResNet-50
- Environment: Google Colab, Jupyter Notebook
- Data Augmentation: ImageDataGenerator (Keras)